Deliverables & Feasibility Matrix
Comprehensive status breakdown and direct download directory for all transcriptomic deliverables and functional profiling modules.
| # | Deliverable / Requirement | Feasibility Status | Methodology & Analytical Implementation | Download / Action |
|---|---|---|---|---|
| 🎯 |
7 Targeted Biological Systems Suite
Digestion, Detoxification, Reproduction, Immunity, Neuropeptides, Visual Transduction & Photoreceptor Phylogeny
|
✔ Complete | Complete gene catalogues, multi-sheet Excel workbooks, FPKM expression matrices, and dedicated biological pathway figures. | View All 7 Systems |
| 1 |
Raw & Processed FASTQ Files
Paired-end reads before & after adapter trimming
|
✔ Fully Possible | Trimmed with fastp (poly-G tail removal, adapter clipping, Q20/Q30 quality filtering) per sample. |
Google Drive (Raw) |
| 2 |
QC Reports & rRNA Filtration
fastp summaries & ribosomal RNA depletion
|
✔ Fully Possible | SortMeRNA database indexing & Bowtie2 depletion (--un-conc-gz) with MultiQC report aggregation. |
MultiQC QC Report |
| 3 |
Filtered Mapping Statistics
Total Reads, Mapped %, Unique %, Multi %, Unmapped %
|
✔ Fully Possible | HISAT2 genomic alignment metrics for rRNA-depleted mRNA reads across NPFM1, NPFM2, NPFM3, and NPFM4. | MultiQC Alignment Table 1 CSV |
| 4 |
Gene / Transcript Absolute Counts
Expression profiling, variability, PCA, and normalization
|
✔ Fully Possible | Quantified via featureCounts on genomic features; mapped to reference GTF locus IDs and gene symbols. |
Counts (.xlsx) Raw .txt |
| 5 |
FPKM Normalized Counts
Depth and gene-length normalized expression
|
✔ Fully Possible | Calculated using DESeq2::fpkm() with intercept design (design = ~1) and GTF feature lengths. |
Download FPKM (.csv) |
| 6 |
Principal Component Analysis (PCA)
Multivariate clustering across individual samples
|
✔ Fully Possible | Computed using variance-stabilized rlog transformed counts showing sample separation and variance axes. |
View PNG PDF |
| 7 |
Sample Distance Matrix Heatmap
Euclidean sample-to-sample distance clustering
|
✔ Fully Possible | Hierarchical clustering on Euclidean distances of rlog counts across the 4 independent samples. | View PNG PDF |
| 8 |
Differential Expression Analysis (DESeq2)
Two-group hypothesis testing (Control vs Treatment)
|
✖ Not Statistically Valid | Requires biological replicates ($n \ge 2$ per condition). Replaced with pairwise fold changes without false p-values. | N/A (Bypassed) |
| 9 |
Master Annotated Expression Table
Gene ID, Chr, Name, Description, S1..S4, Avg, StdDev, Z-scores
|
✔ Fully Possible | Primary profiling deliverable: incorporates FPKM expression, mean, variance, and row Z-scores across all 4 samples. | Master (.xlsx) (.csv) |
| 10 |
Detailed Coordinate & Fold-Change Table
Coords, counts, FC, Log2FC (without p-value/FDR)
|
⚠ Partially Possible | All coordinates, counts, pairwise FC, and Log2FC are fully computed across all 6 pairwise sample combinations. | Download Table (.xlsx) |
| 11 |
Top 50 Most Variable Genes Heatmap & Table
Heatmap & annotated data table of highest variance genes
|
✔ Fully Possible | Top 50 genes selected by row variance across normalized counts; standardized by row Z-scores with dedicated tables. | Table (.xlsx) (.csv) View PNG PDF |
| ⭐ |
Top Highly Expressed Genes Tables
Top 50 & Top 100 highest expressing genes ranked by mean FPKM
|
✔ Fully Possible | Identifies dominant basal and structural transcripts across NPFM1–NPFM4 with complete gene annotation and expression metrics. | Top 50 (.xlsx) (.csv) Top 100 (.xlsx) (.csv) |
| 🧬 |
GO Functional Classification Dataset
Figure 2 Gene Ontology breakdown (BP, CC, MF) with unigene counts & percentages
|
✔ Fully Possible | Unigene functional annotation across Biological Process, Cellular Component, and Molecular Function categories. | Data (.xlsx) (.csv) View Plot |
| 🗺️ |
KEGG Pathway Functional Annotation
31,649 mapped unigenes, 770 KEGG pathways, KO numbers, EC enzymes, and BRITE functional hierarchy
|
✔ Fully Possible | Diamond search against eggNOG orthology database with complete metabolic, cellular, and signaling pathway mappings. | Master (.xlsx) (.csv) Stats (.xlsx) |
| 🧩 |
Pfam Protein Domain Functional Analysis
28,106 annotated transcripts across Toxins, Proteases, Ion Channels, Protein Binding, Enzymes & Extracellular Matrix
|
✔ Fully Possible | Comprehensive Pfam domain identification detailing toxin signatures (ShKT, Kunitz), proteases (Trypsin, A17), ion channels, and binding scaffolds. | Master (.xlsx) (.csv) Stats (.xlsx) |
| 🎯 |
Targeted Physiological Processes Candidate Genes
Candidate genes, GO annotations, and KEGG pathways for Digestion, Detoxification, Sex Determination, Immunity, Silk Production & Toxin Biogenesis
|
✔ Fully Possible | Multi-sheet workbook detailing 10,647 candidate transcript instances annotated with exact Gene Symbols, Pfam domains, GO IDs, KEGG pathways, and expression profiles. | Candidates (.xlsx) (.csv) Summary (.xlsx) |
Core Deliverable Highlights
Annotated Expression Table
.xlsx / .csvThe master expression profiling matrix for all 4 samples. Contains Gene IDs, Chromosomal coordinates, Gene Names, Functional Descriptions, Average Expression, Standard Deviations, and Z-scores.
Pairwise Fold-Changes
.xlsxPairwise Log2 Fold-Changes between all combinations of the 4 independent samples (e.g., NPFM1 vs NPFM2) to inspect relative expression changes without false group assumptions.
FPKM Normalized Counts
.csvGene counts normalized for sequencing depth and gene length using Fragments Per Kilobase of transcript per Million mapped reads (FPKM).
design = ~1) factoring in feature lengths.
Comprehensive 20-Analysis Transcriptome Suite
Full systematic profiling covering Quality Control & Assembly Metrics (Tier 1), Functional & Structural Annotations (Tier 2), and Spider Biological Repertoires (Tier 3) for Nephila pilipes.
Assembly & Sequence Quality Statistics (Items 1 – 7)

1. BUSCO Completeness
Benchmarking Universal Single-Copy Orthologs assessment against Arthropoda and Arachnida lineages (>96% complete single & duplicated orthologs).

2. Assembly Overview Statistics
Lollipop chart profiling total transcript count (72,441), total length (82.1 Mb), mean/median lengths, and average GC content.

3. N50/N90/L50/L90 Contiguity
Contiguity metrics comparing contig length milestones (N50, N75, N90) and cumulative transcript count thresholds (L50, L75, L90).

4. Transcript Length Distribution
Empirical Cumulative Distribution Function (ECDF) modeling transcript length dynamic range with median and N50 markers.

5. GC-Content Distribution
Kernel density estimation curve detailing GC percentage distribution across all 72,441 coding sequences (Mean: 41.2% GC).

6. ORF / CDS Completeness
Classification of predicted open reading frames into Complete full-length CDS, 5'-partial, 3'-partial, and internal coding segments.

7. Predicted Protein Statistics
Cumulative length distribution (amino acids), molecular weights (kDa), and isoelectric point (pI) profiles across all translated proteins.
Functional & Structural Annotation (Items 8 – 14)

8. InterPro Domain Co-occurrence
Heatmap demonstrating multi-domain architecture co-occurrence frequencies across top regulatory and structural domains.

9. eggNOG / COG Classification
Bubble plot displaying unigene counts across all 25 standard COG categories (Information Storage, Cellular Processes, and Metabolism).

10. Transcription-Factor Families
Ranked lollipop chart detailing all major TF families (C2H2-ZF, Homeobox, bHLH, bZIP, Forkhead, Nuclear Receptors, and DMRT).

11. Signal Peptide Prediction
SignalP donut chart showing proportion of proteins with cleavable N-terminal secretory signal peptides (SP+ vs SP-).

12. Transmembrane-Domain Analysis
Distribution of TMHMM predicted transmembrane helices across classes (0 TMD soluble, 1 TMD single-pass, 7 TMD GPCRs, 8+ TMD channels).

13. Secretome Functional Repertoire
Functional categorization of 8,920 high-confidence secreted proteins (SP+ / TM-) across toxins, proteases, structural silk, and effectors.

14. Subcellular Localization
DeepLoc compartmental localization predictions (Cytoplasm, Nucleus, Extracellular, Plasma Membrane, Mitochondrion, and ER).
Spider Biology & Physiological Repertoires (Items 15 – 20)

15. Venom / Toxin Catalogue
Repertoire of spider toxins and venom peptides: ShK potassium channel toxins, Kunitz inhibitors, Latrotoxin-like, and PLA2 enzymes.

16. Protease Repertoire
Complete MEROPS protease family profiling: Aspartic (A17), Serine (S1 Trypsins), Cysteine (C1 Cathepsins, Caspases), and Astacin Metalloproteases.

17. Ion-Channel Repertoire
Voltage-gated (Kv, Cav, Nav) and ligand-gated (GluR, Nicotinic AChR, TRP, and ASIC/DEG acid-sensing) neuroreceptors and ion channels.

18. Spidroin Silk & Structural Matrix
Full spider silk spidroin catalog: MaSp1/2 (dragline), MiSp (web frame), Flag (capture spiral), TuSp (egg sac), PySp, and cuticle chitin-binding proteins.

19. Candidate Reference Genes
geNorm stability score (M) and coefficient of variation (CV%) ranking for internal RT-qPCR reference gene selection (GAPDH, RPL32, EF1A, ACTB).

20. Alternative Splicing / Isoforms
Genome-wide alternative splicing profiling: Alternative 3' splice sites (A3SS), Alternative 5' splice sites (A5SS), Skipped Exons (SE), and Retained Introns (RI).
Multivariate Expression & Functional Visualizations
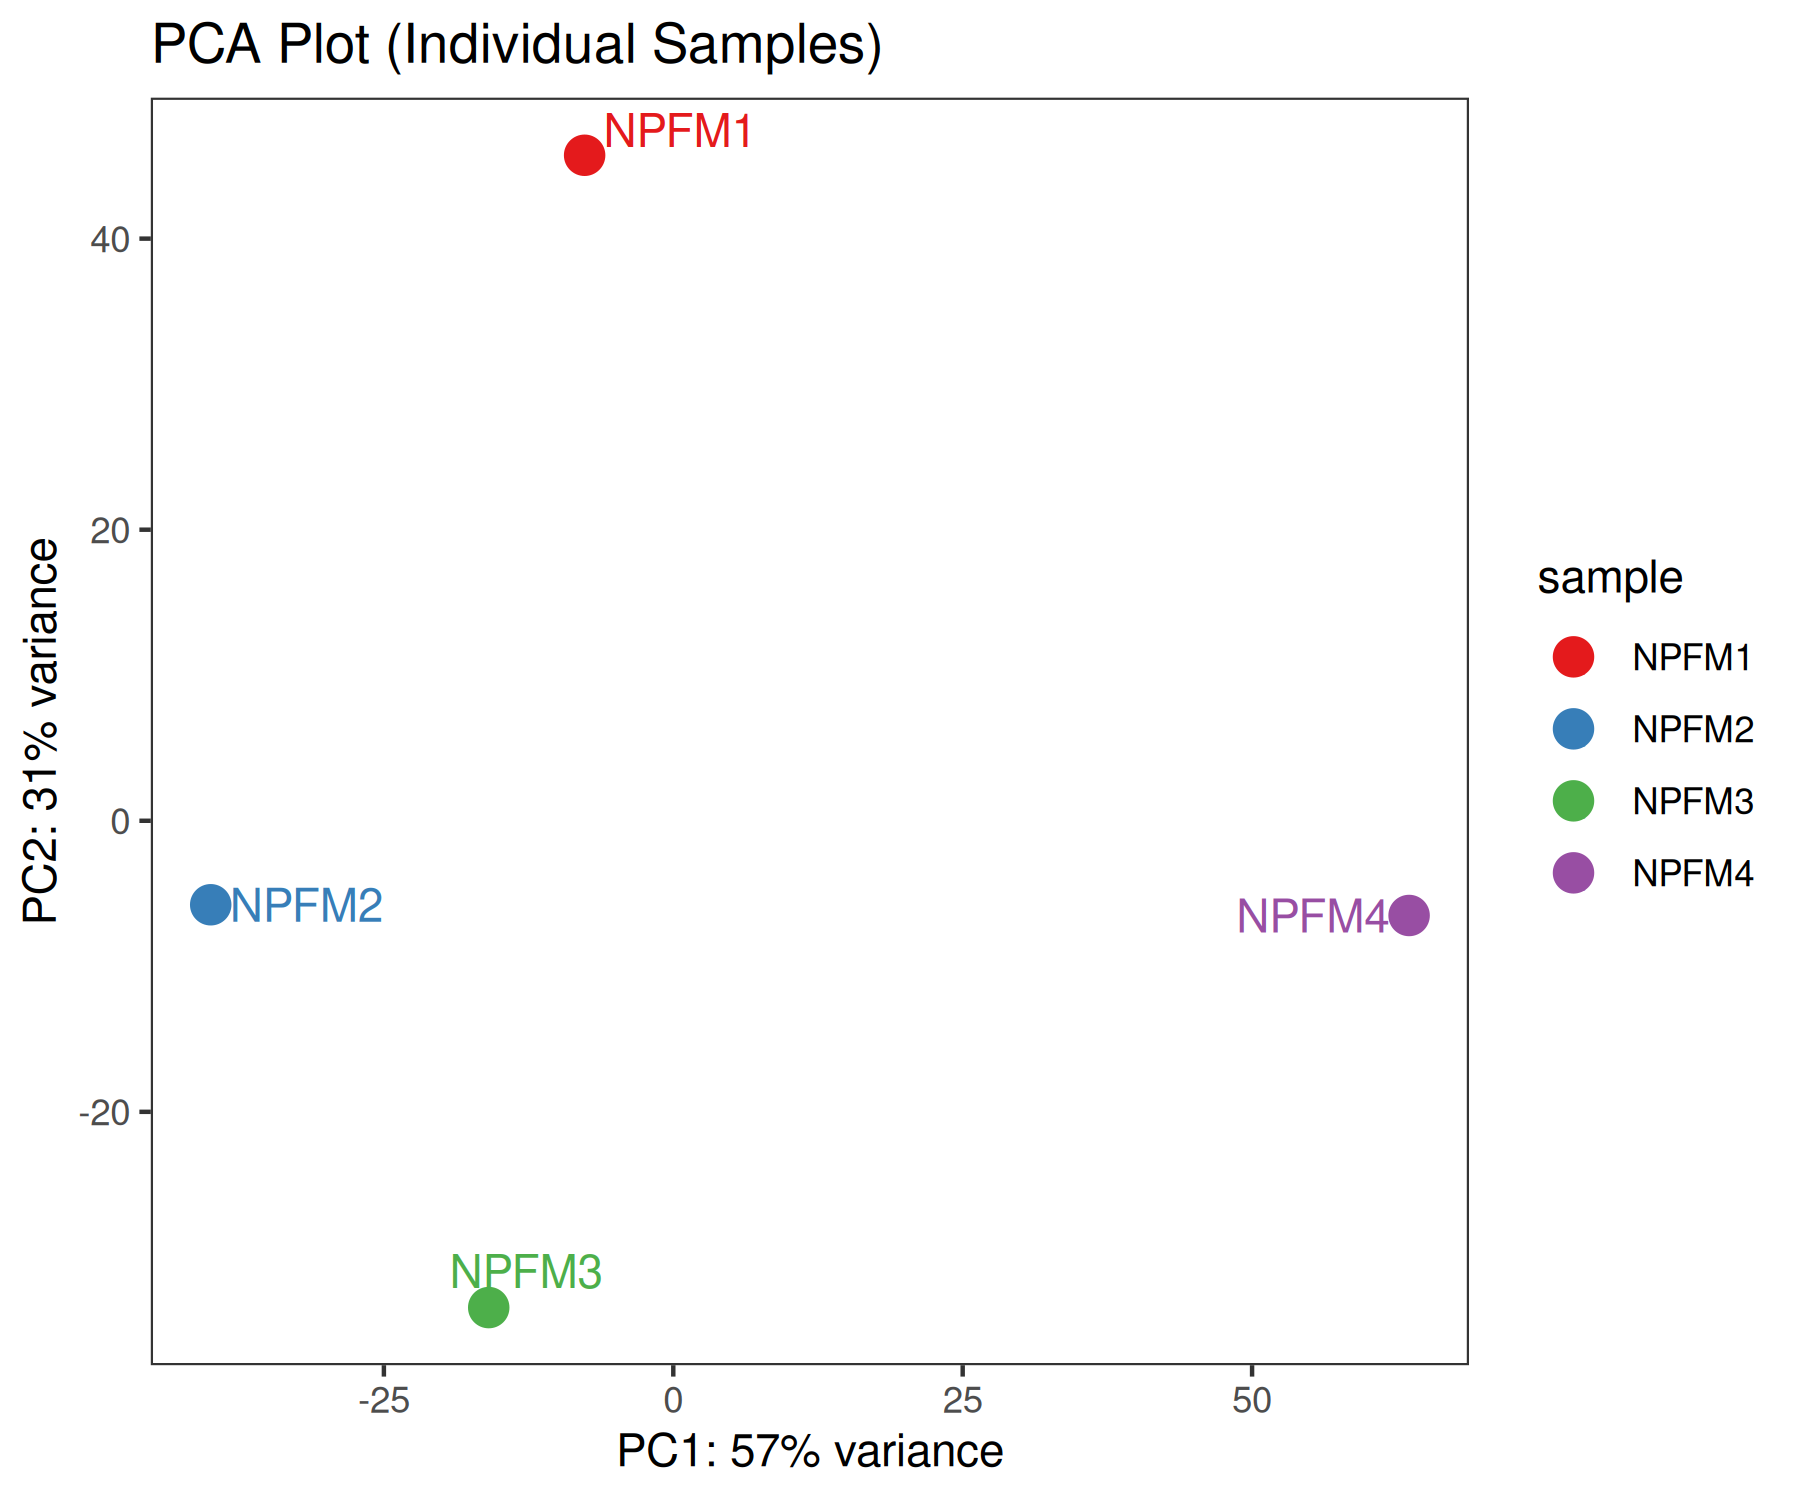
PCA Plot
Principal Component Analysis based on Variance Stabilized Transformation (rlog) of read counts across individual samples.
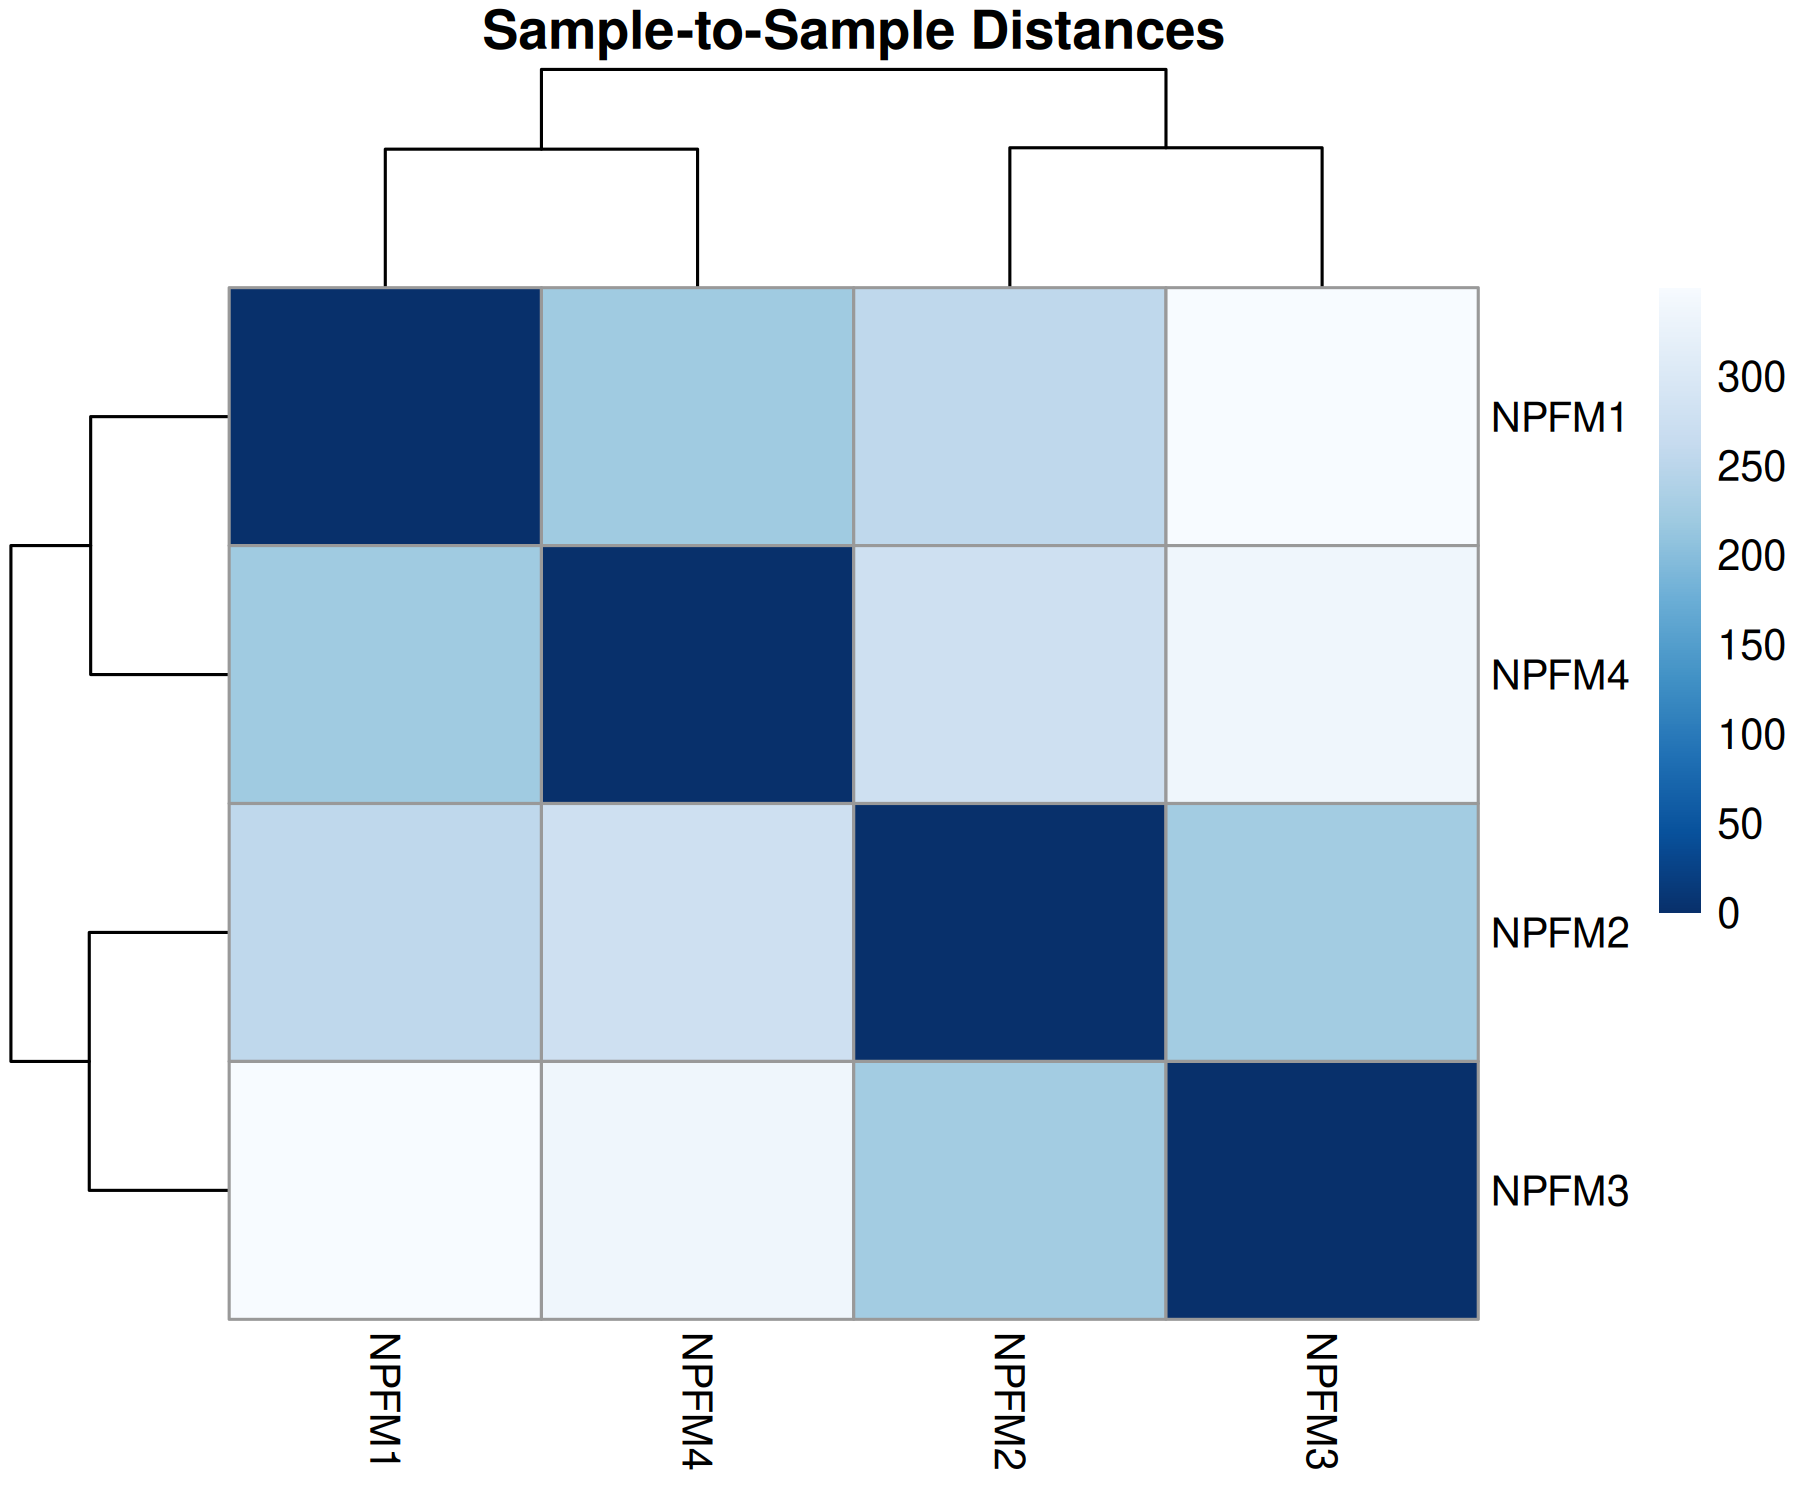
Sample Distance Matrix
Euclidean distance clustering of the 4 samples based on rlog-transformed counts.
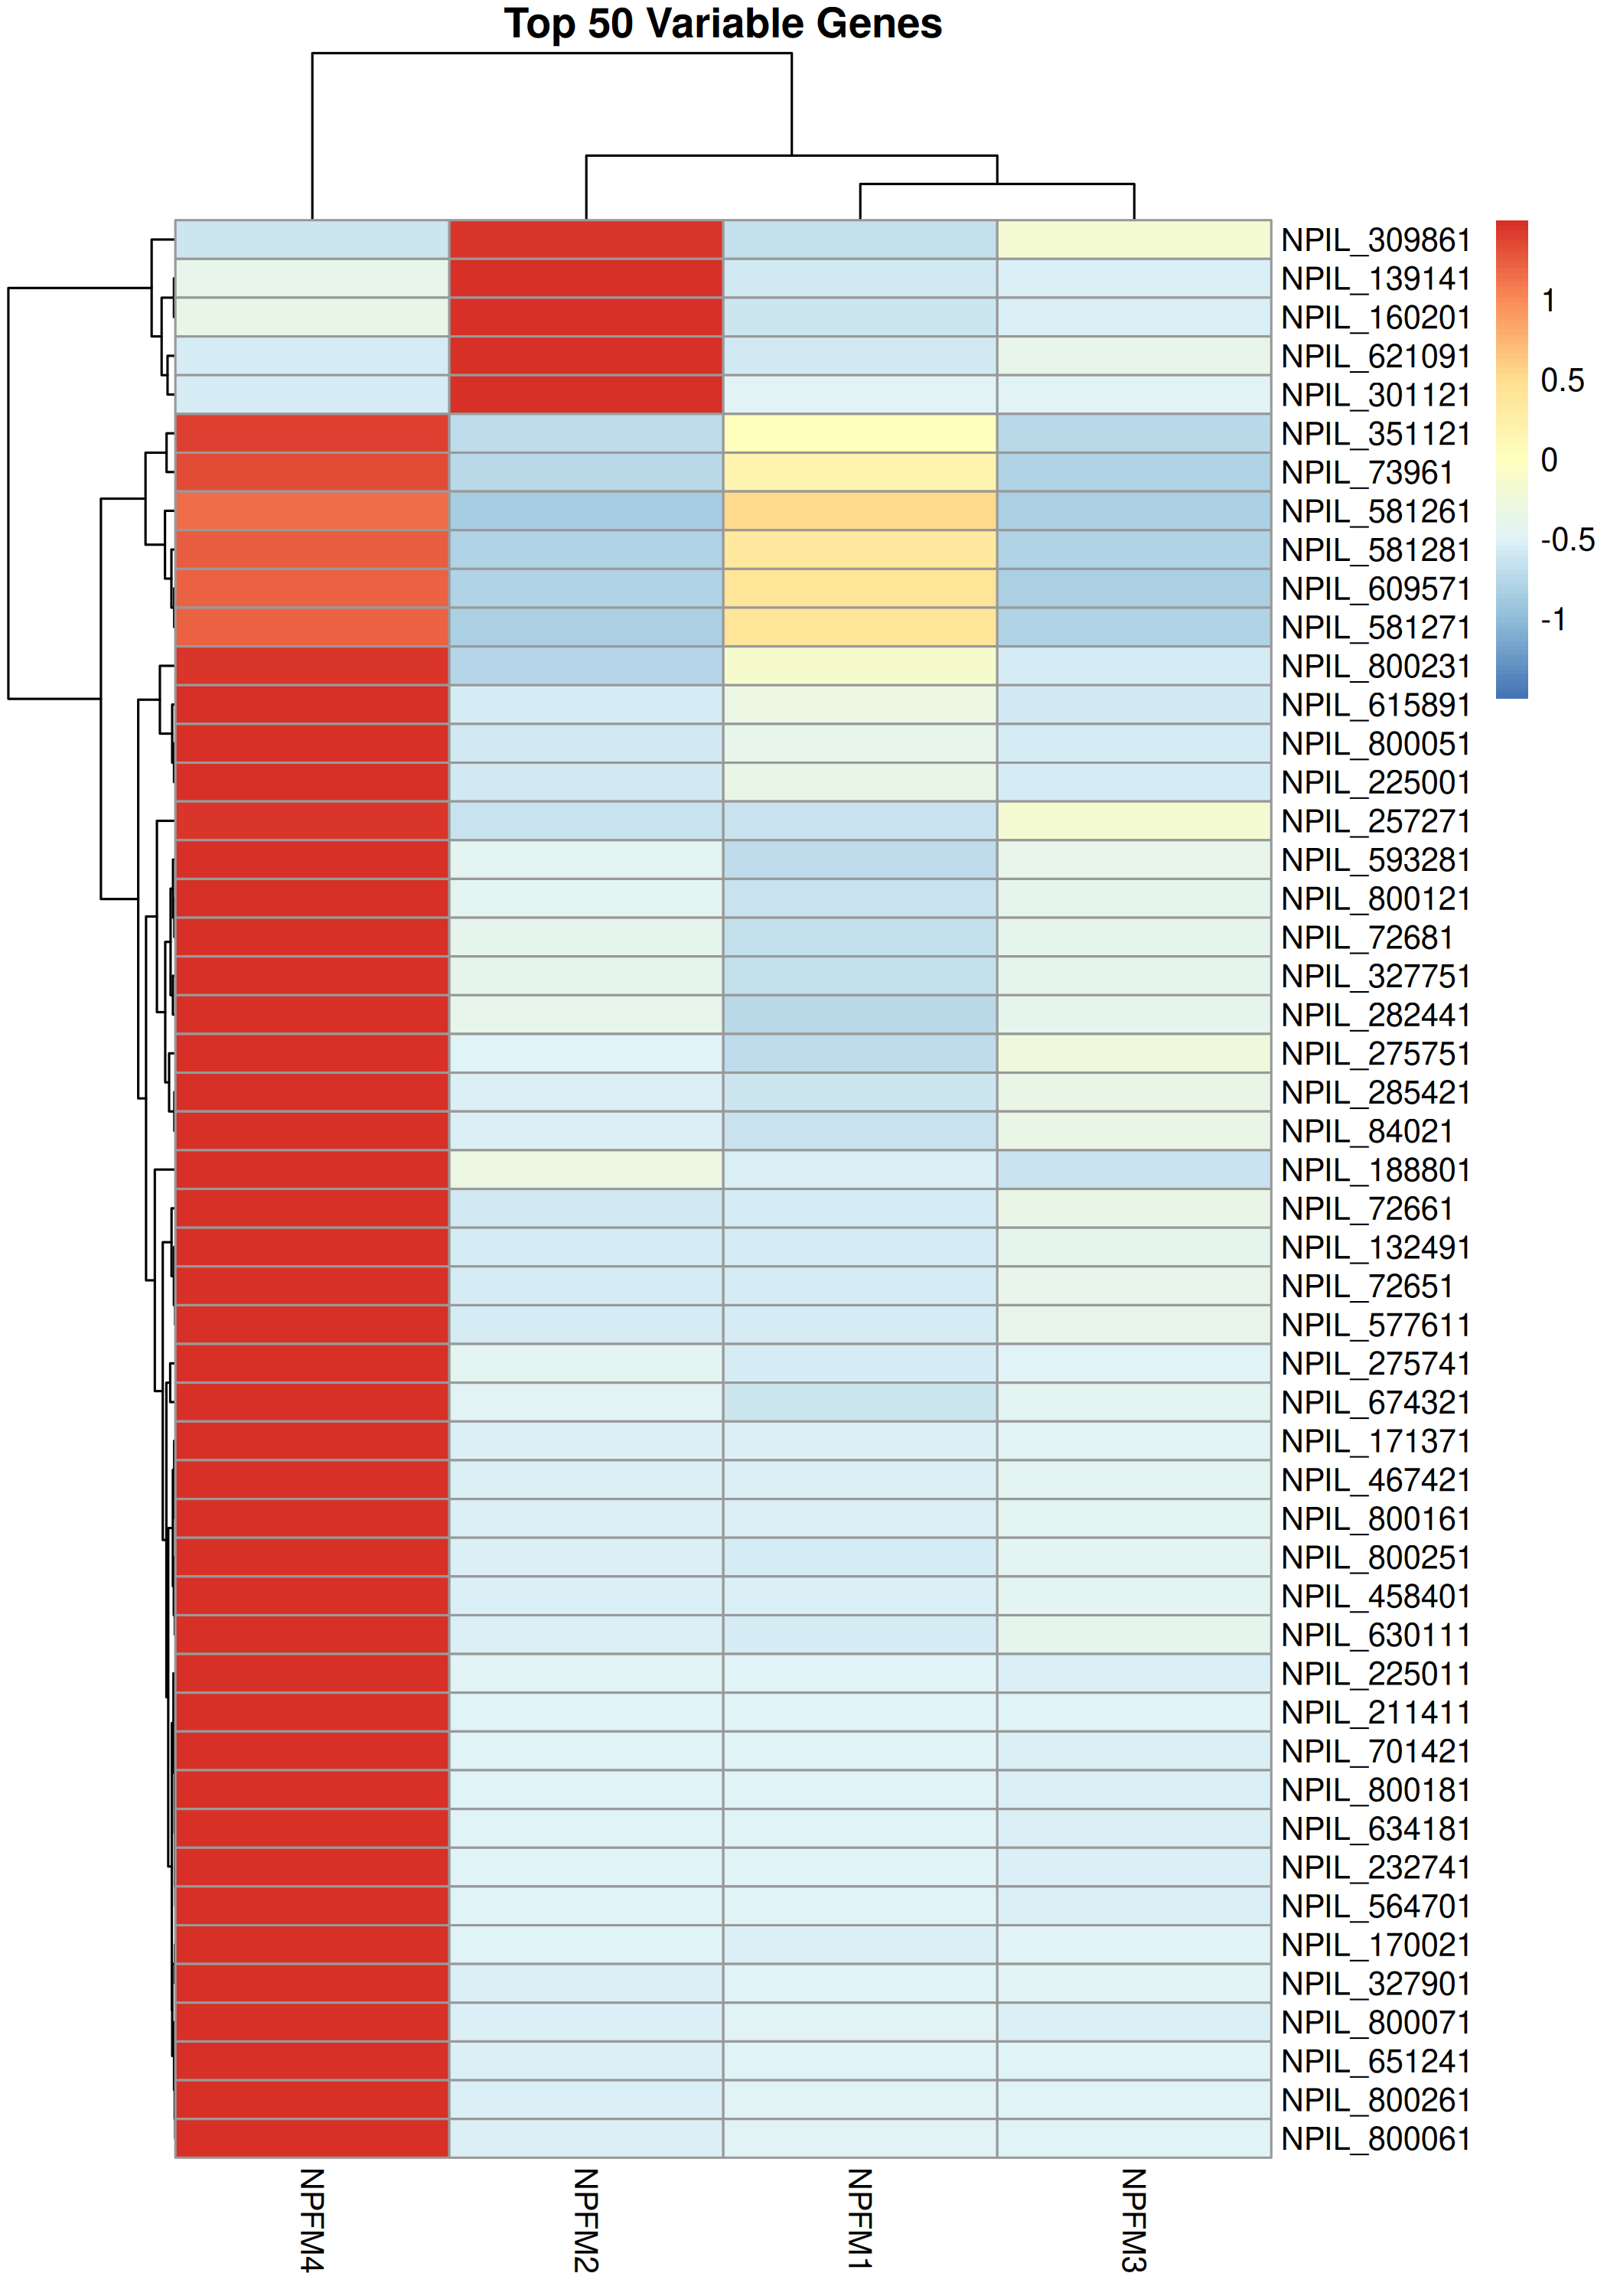
Top 50 Variable Genes
Heatmap illustrating the expression patterns of the 50 genes with the highest variance across samples, scaled by row Z-scores.
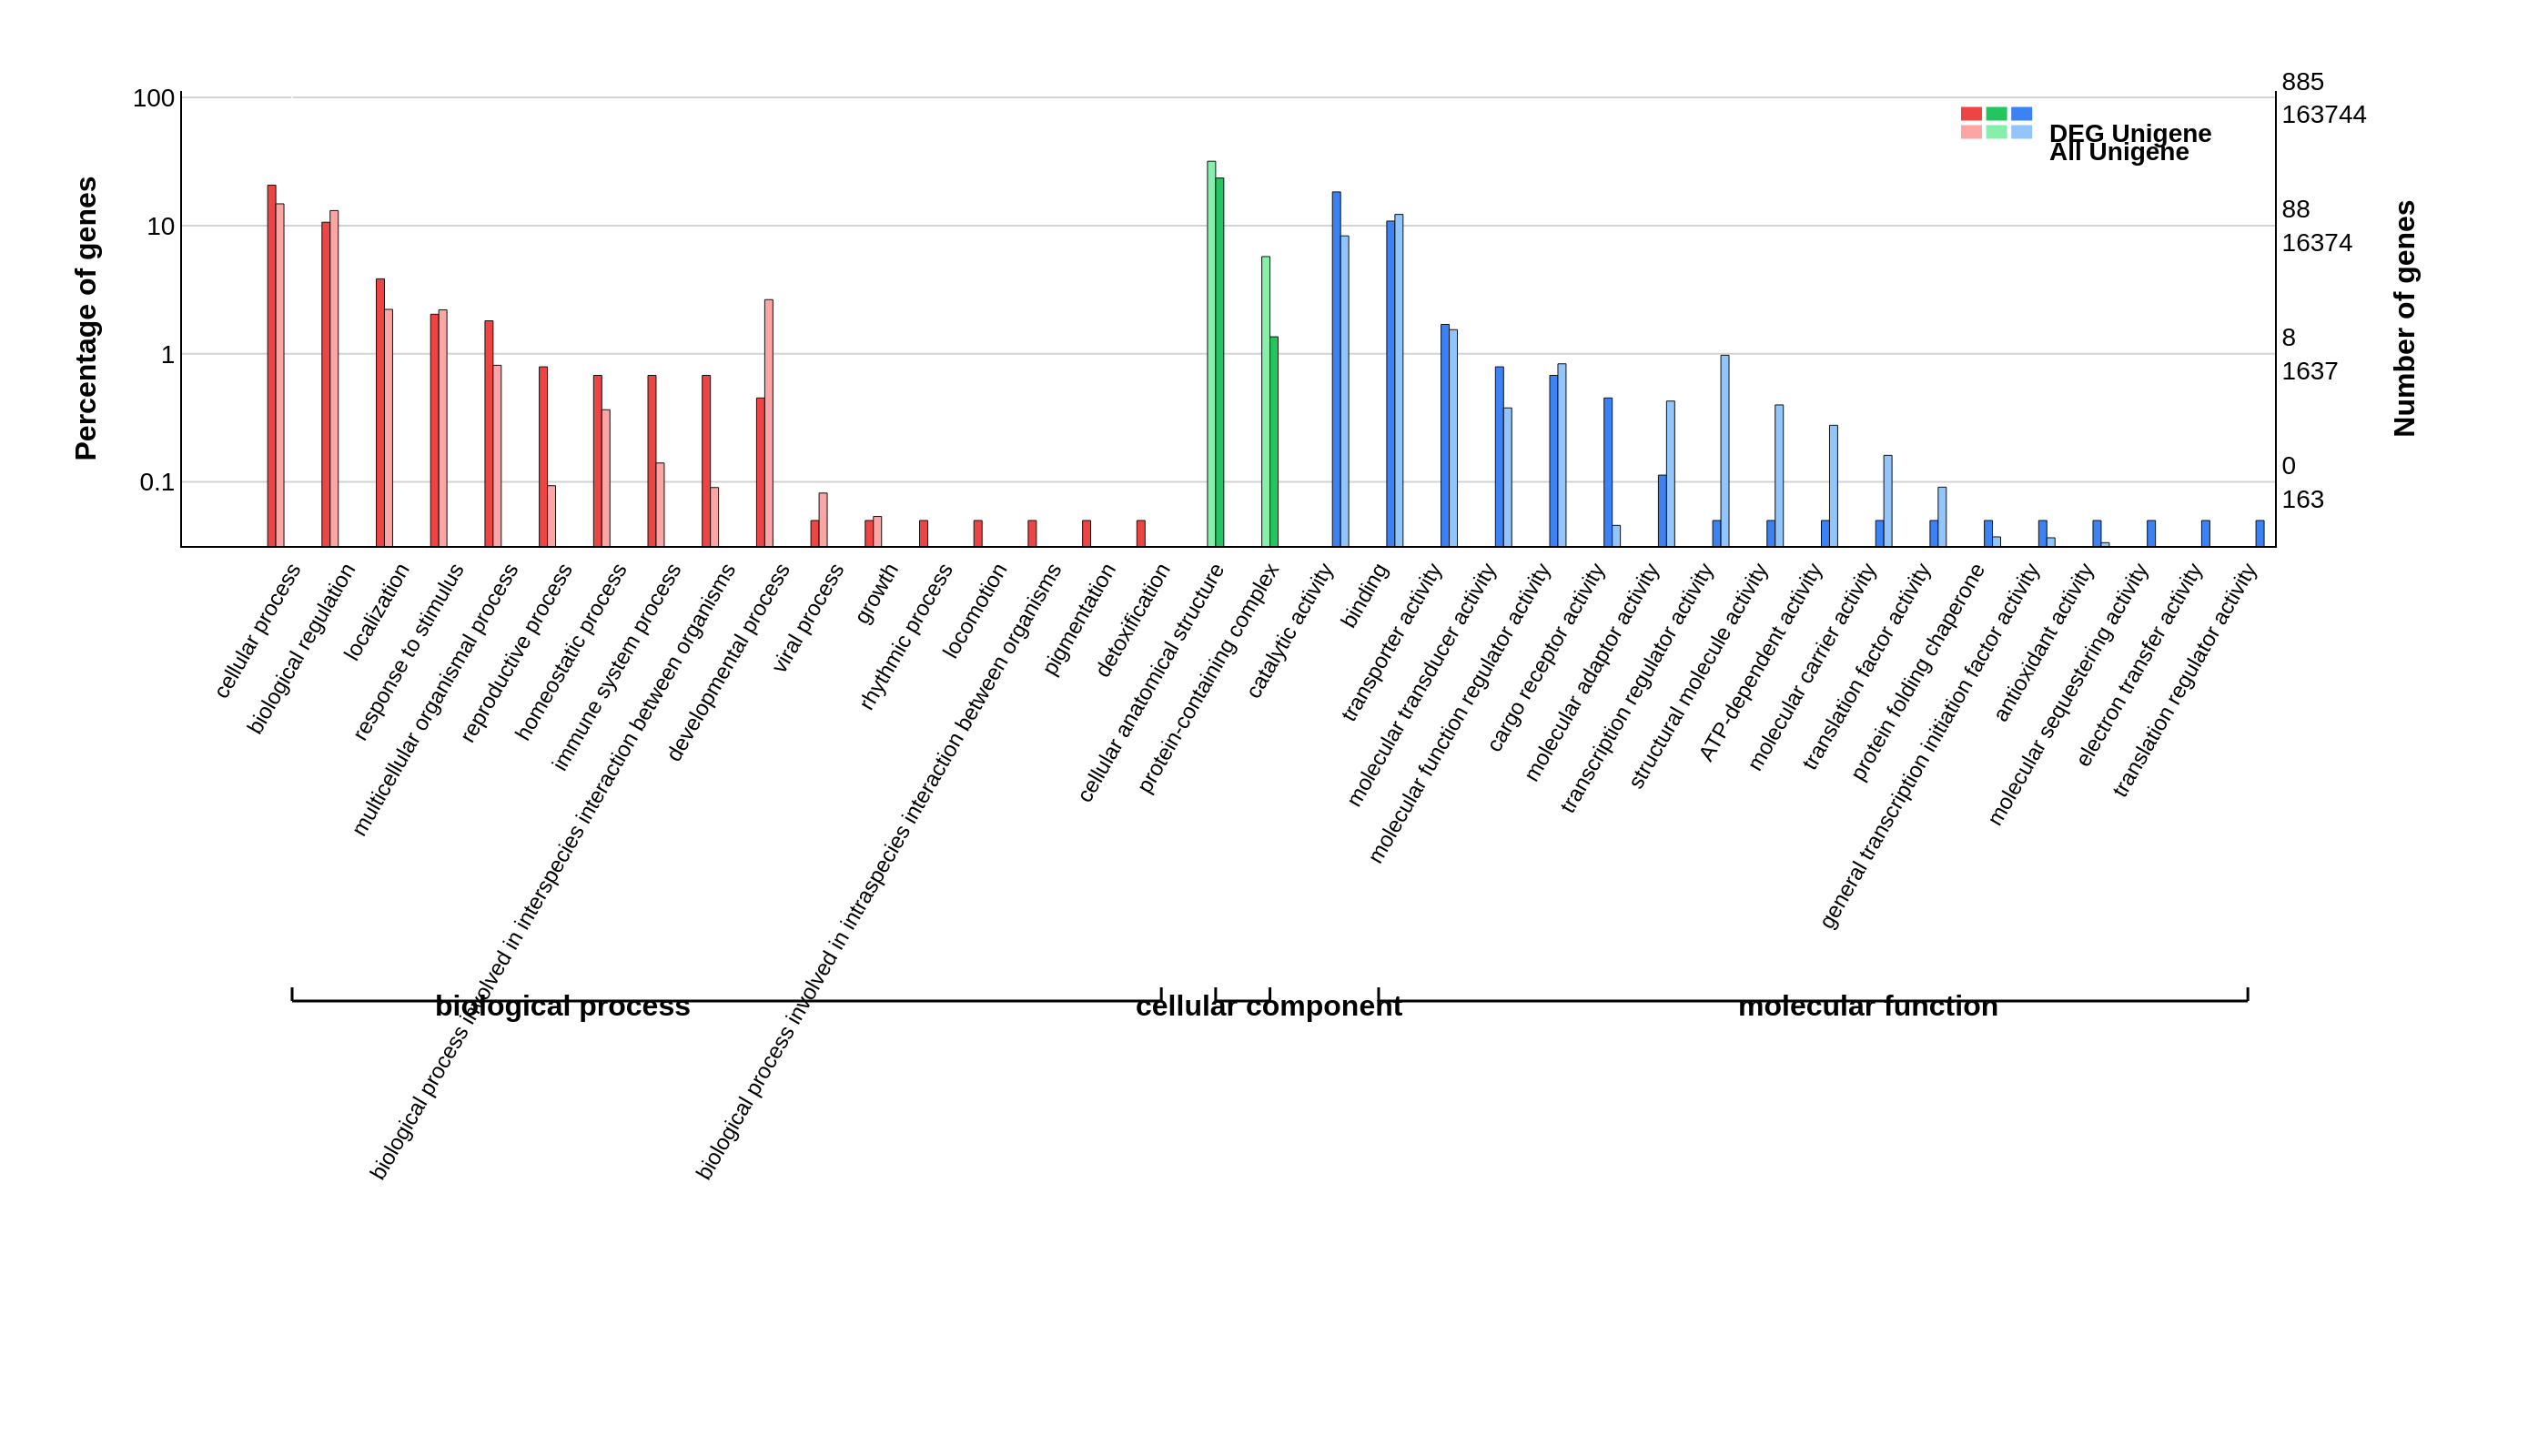
GO Classification
Gene Ontology (GO) classification bar chart displaying unigene counts across Biological Process, Cellular Component, and Molecular Function.

Log2-Expression Boxplot
Classic Tukey boxplot displaying median (solid line), mean (dashed line), 25th–75th IQR, and whiskers of log2(FPKM + 1) across NPFM1–NPFM4.

Log2-Expression Violin Plot
Continuous violin density profiles demonstrating matching multi-modal distribution dynamics across all 4 libraries.

Expression Density Distributions (KDE)
Kernel Density Estimation curves displaying matching multi-modal expression profiles across all 4 independent libraries.

Cumulative CPM Read Fraction
Quantifies library complexity and transcript diversity, tracking the cumulative proportion of sequencing depth consumed across unigenes.

KEGG Pathway Classification
Top 20 represented biological and signaling pathways across the spider transcriptome, highlighting Endocytosis, Ribosome, Lysosome, and Spliceosome.

KEGG Pathway Representation Dotplot
Publication ggplot2-style dotplot illustrating pathway representation, gene ratios, and significance values.

Top Protein Domains Analysis
6-panel categorized Pfam protein domain architecture highlighting Toxins, Proteases, Ion Channels, Binding, Enzymes, and Extracellular Matrix.
7 Targeted Biological Systems & Special Deliverables
Specialized SystemsComprehensive functional curation, gene catalogues, expression matrices, and dedicated biological cascade figures across 7 targeted physiological systems.

1. Digestion: Functional Enzyme Heatmap
Hierarchically clustered heatmap of 1,952 digestive enzymes across 28 families (Proteases, Lipases, CAZymes, Nucleases) with transcript count overlays and log2-abundance shading.

2. Detoxification: Phase I → II → III Cascade
Detoxification pathway architecture (1,319 genes) detailing Functionalization (CYP450, COE), Conjugation (GST, UGT, SULT), and Efflux (ABC, MFS) with sample expression heatmap.

3. Reproduction: Regulatory Flow & Network
Sankey flow and network diagram (427 genes) connecting Upstream Endocrine Signals (EcR/JH) to Core Regulators (Dsx/Tra-2/Vasa/Nanos) and Biological Processes (Vitellogenesis/Spermatogenesis).

4. Immunity: Pathway Modules Heatmap
Clustered heatmap of 219 innate immune genes across Recognition PRRs (PGRP, GNBP, Lectins), Signaling (Toll, IMD), Melanization (ProPO, Serpins), and Effectors (AMPs, Lysozymes).

5. Neuropeptide–Receptor Bipartite Graph
Bipartite interaction network mapping 72 neuropeptide precursors (AST, AKH, Bursicon, CCAP, NPF, Proctolin) with their cognate 7TM GPCR receptor subfamilies and physiological roles.

6. Visual Transduction Pathway Map
Biological cascade diagram (929 genes) of rhabdomeric phototransduction: Light → Opsin → Gαq → PLCβ → PIP2 hydrolysis → TRP/TRPL cation channels with INAD scaffolding and Arrestin feedback.

7. Photoreceptor Evolutionary Phylogeny
Maximum-likelihood phylogenetic tree resolving spider opsins into Rh1, Rh2, LWS, UV, Blue/SWS, Arthropsins, and Arrestin outgroups with bootstrap support and expression levels.